Market Outlook
October 06, 2016
Market Cues
Domestic Indices
Chg (%)
(Pts)
(Close)
Indian markets are likely to open positive tracking global markets and SGX NIFTY.
BSE Sensex
(0.4)
(114)
28,221
Nifty
(0.3)
(25)
8,744
After moving lower over the last two previous session US markets closed on a
Mid Cap
0.5
68
13,617
positive note on Wednesday. The gain on Wall Street came following the release of
a series of economic data, showing improvement in acceleration in service sector
Small Cap
0.6
81
13,290
growth in the month of September.
Bankex
(0.8)
(176)
22,316
The European markets closed marginally negative with FTSE closing down by 0.6%
and DAX & CAC closing 0.3% each. The markets started on weak note amid
Global Indices
Chg (%)
(Pts)
(Close)
concerns over possibility of monetary tightening by the European central bank.
Dow Jones
0.6
112
18,281
Indian markets closed with a negative note on Wednesday. Despite RBI’s liberal
Nasdaq
0.5
26
5,316
action of rate cut by 25 bps, banking stocks have failed to attract buyer’s interest. As
FTSE
(0.6)
(41)
7,033
we have highlighted earlier that now the focus will be more on quarterly results.
Nikkei
0.5
84
16,819
While auto companies have reported strong sales numbers for 2QFY17, which
Hang Seng
0.4
99
23,788
would translate into encouraging numbers, other heavy weight sectors like banks
could report a mixed bag of results.
Shanghai Com
0.2
6
3,005
News Analysis
Advances / Declines
BSE
NSE
Adani buys R-Infra’s transmission biz
Advances
1,747
954
Detailed analysis on Pg2
Declines
1,147
661
Investor’s Ready Reckoner
Unchanged
128
69
Key Domestic & Global Indicators
Volumes (` Cr)
Stock Watch: Latest investment recommendations on 150+ stocks
Refer Pg5 onwards
BSE
3,914
NSE
21,251
Top Picks
CMP
Target
Upside
Company
Sector
Rating
(`)
(`)
(%)
Net Inflows (` Cr)
Net
Mtd
Ytd
Amara Raja Batteries Auto & Auto Ancillary Accumulate
1,055
1,174
11.3
FII
243
855
50,860
HCL Tech
IT
Buy
816
1,000
22.6
MFs
(350)
253
14,200
Bharat Electronics
Capital Goods
Accumulate
1,273
1,414
11.1
Equitas Holdings
Financials
Buy
186
235
26.1
Navkar Corporation Others
Buy
193
265
37.3
Top Gainers
Price (`)
Chg (%)
More Top Picks on Pg3
Bajajhldng
2,138
8.3
Tataglobal
153
8.0
Key Upcoming Events
Previous
Consensus
Kscl
411
7.7
Date
Region
Event Description
Reading
Expectations
Tatacomm
612
6.3
Oct 06 Germany
PMI Services
50.60
50.60
Oct 07 UK
Industrial Production (YoY)
2.10
1.30
Gmdcltd
93
5.9
Oct 07 India
Industrial Production YoY
(2.40)
Oct 07 US
Change in Nonfarm payrolls
151.00
174.00
Top Losers
Price (`)
Chg (%)
Oct 10 US
Unnemployment rate
4.90
4.90
Cesc
614
(2.9)
Oct 13 India
Imports YoY%
(14.09)
Ongc
267
(2.6)
Oct 13 India
Exports YoY%
(0.30)
Bfutilitie
591
(2.1)
Oct 13 China
Exports YoY%
(2.80)
(3.30)
6.(
More Events on Pg4
Amtekauto
47
(2.1)
Axisbank
536
(2.0)
As on October 05, 2016
Market Outlook
October 06, 2016
News Analysis
Adani buys R-Infra’s transmission biz
Adani Transmission Ltd has signed a binding term agreement with Reliance Infra
to buy out the later’s power transmission business. Post completion of the deal
Adani Transmission will become the country’s largest pvt sector transmission
network player. Reliance infra intends to pare its debts from the proceeds of
the deal. After completing the deal Adani’s transmission network will cross
10,000 Km.
According to the deal R-Infra will transfer the Western Region Strengthening
Scheme (WRSSS) - B&C and Parbati Koldam Transmission Company to Adani
Transmission. While the move will help scale up Adani’s operations, it would help
deleverage the Anil Ambani led group company, which has been monetizing
various assets to reduce its debt.
Economic and Political News
Delhi High court allows RBI to intervene in DoCoMo’s $1.17 Bn award
against Tata.
IMF warns of global financial stability risks
Govt closes day with bid worth `63,500cr on spectrum auction
Corporate News
Cabinet allows ONGC Videsh to buy 11% stake in Russia’s JSC Vankorneft
NBCC secures business worth `1,117cr in September
Orient Cement in talks to buy 74% in JP Bhilai Cement for `750cr
Market Outlook
October 06, 2016
Top Picks ★★★★★
Large Cap
Market Cap
CMP
Target
Upside
Company
Rationale
(` Cr)
(`)
(`)
(%)
To outpace battery industry growth due to better technological
Amara Raja Batteries
18,017
1,055
1,174
11.3
products leading to market share gains in both the
automotive OEM and replacement segments.
Uptick in defense capex by government when coupled with
Bharat Electronics
30,551
1,273
1,414
11.1
BELs strong market positioning, indicate that good times are
ahead for BEL.
The stock is trading at attractive valuations and is factoring all
HCL Tech
1,15,068
816
1,000
22.6
the bad news.
Back on the growth trend, expect a long term growth of 14%
Infosys
2,39,146
1,041
1,370
31.6
to be a US$20bn in FY2020.
Source: Company, Angel Research
Mid Cap
Market Cap
CMP
Target
Upside
Company
Rationale
(` Cr)
(`)
(`)
(%)
Among the top 4 players in the consumer durables segment.
Bajaj Electricals
2,699
267
306
14.6
Improved profitability backed by turn around in E&P
segment. Strong order book lends earnings visibility.
With a focus on the low and medium income (LMI) consumer
Dewan Housing Finance
8,652
297
325
9.6
segment, the company has increased its presence in tier-II &
III cities where the growth opportunity is immense.
Strong loan growth backed by diversified loan portfolio and
adequate CAR. ROE & ROA likely to remain decent as risk of
Equitas Holdings
6,250
186
235
26.1
dilution remains low. Attractive valuations considering
growth.
Economic recovery to have favourable impact on advertising
& circulation revenue growth. Further, the acquisition of a
Jagran Prakashan
6,667
204
225
10.3
radio business (Radio City) would also boost the company's
revenue growth.
Speedier execution and speedier sales, strong revenue
Mahindra Lifespace
1,803
439
522
18.8
visibilty in short-to-long run, attractive valuations
Massive capacity expansion along with rail advantage at ICD
Navkar Corporation
2,752
193
265
37.3
as well CFS augurs well for the company
Market leadership in Hindi news genre and no. 2 viewership
ranking in English news genre, exit from the radio business,
TV Today Network
1,855
311
363
16.8
and anticipated growth in ad spends by corporates to benefit
the stock.
Source: Company, Angel Research
Market Outlook
October 06, 2016
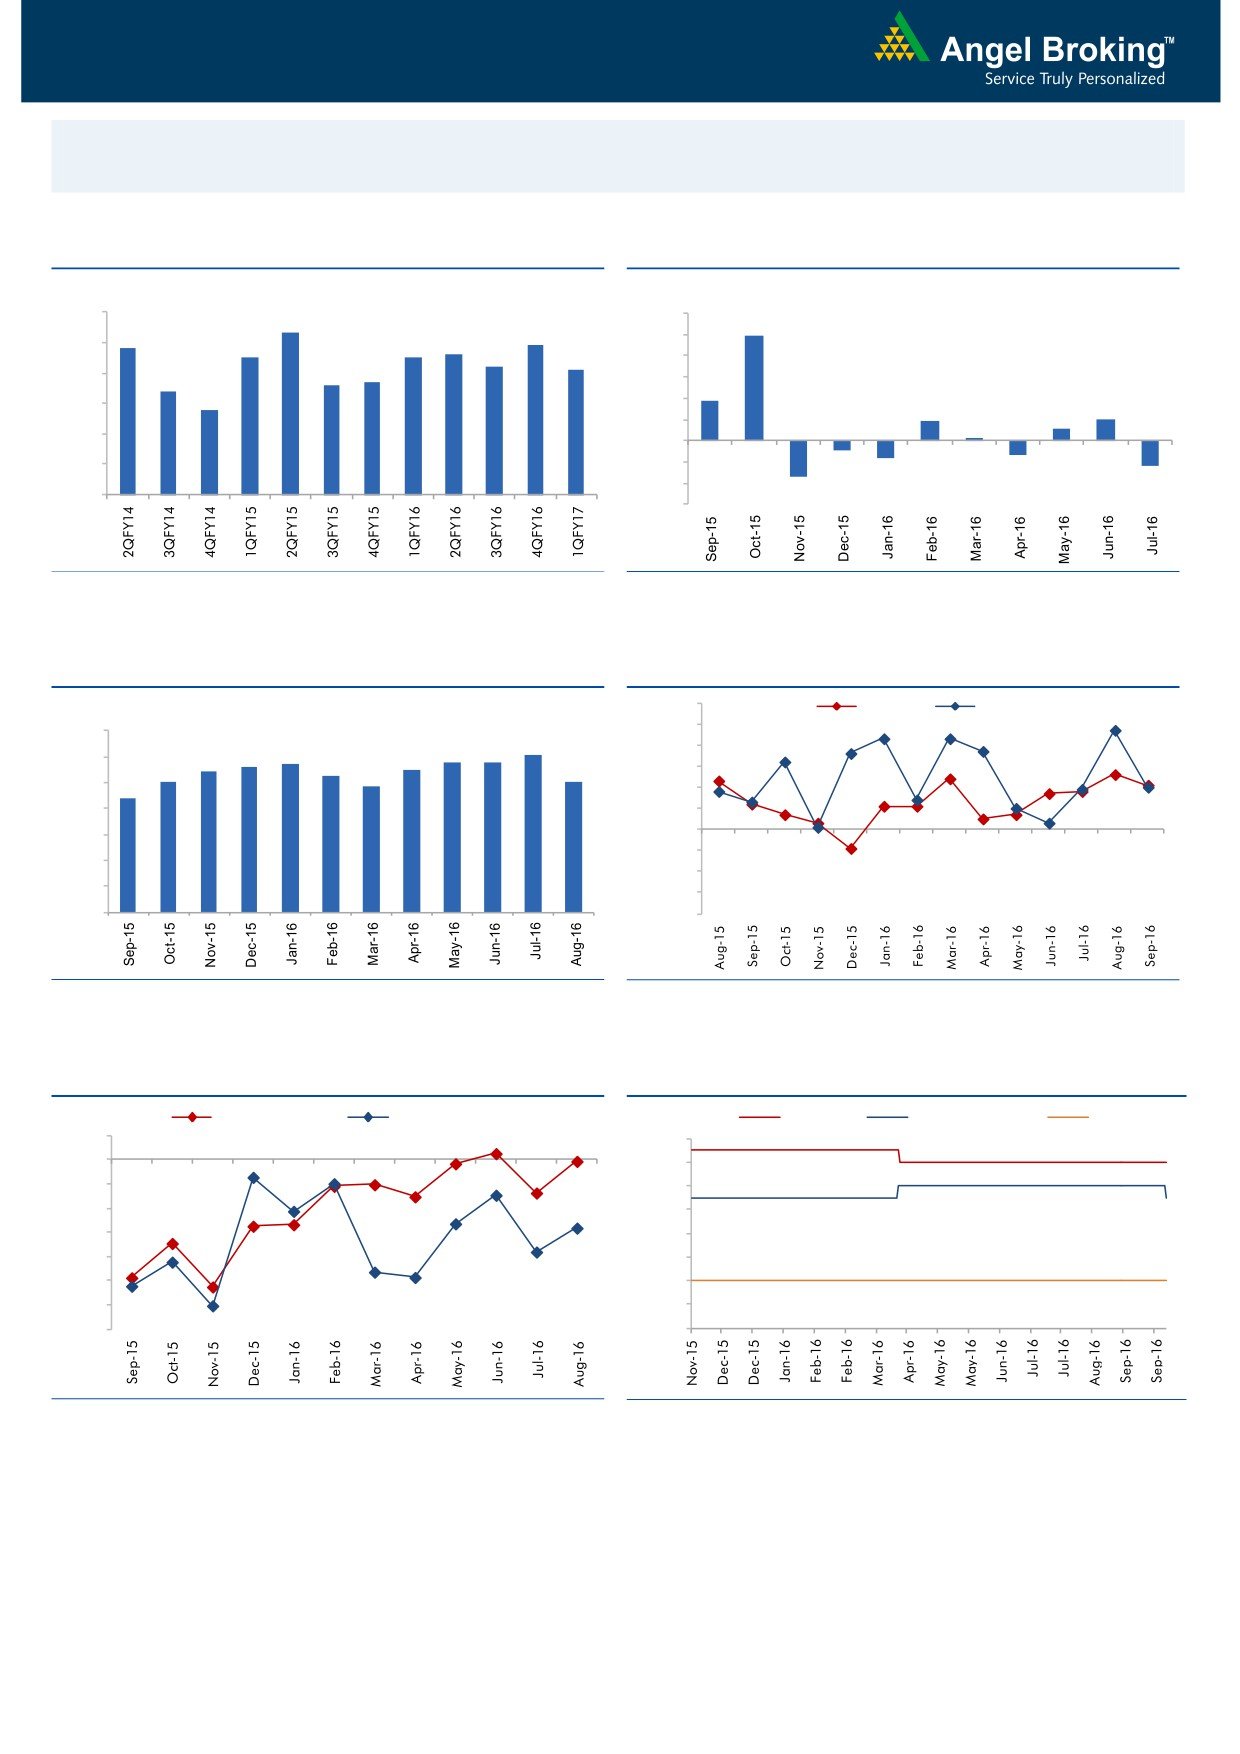
Macro watch
Exhibit 1: Quarterly GDP trends
Exhibit 2: IIP trends
(%)
(%)
9.0
12.0
8.3
9.9
7.8
7.9
8.0
7.5
7.5
7.6
10.0
7.2
7.1
8.0
6.6
6.7
7.0
6.4
6.0
3.7
5.8
6.0
4.0
1.9
2.0
1.1
2.0
0.3
5.0
-
4.0
(2.0)
(0.9)
(1.3)
(1.6)
(4.0)
(2.4)
3.0
(3.4)
(6.0)
Source: CSO, Angel Research
Source: MOSPI, Angel Research
Exhibit 3: Monthly CPI inflation trends
Exhibit 4: Manufacturing and services PMI
56.0
Mfg. PMI
Services PMI
(%)
55.0
7.0
6.1
5.7
5.8
5.8
54.0
6.0
5.4
5.6
5.5
5.0
5.3
5.1
53.0
4.8
5.0
4.4
52.0
4.0
51.0
50.0
3.0
49.0
2.0
48.0
1.0
47.0
-
46.0
Source: MOSPI, Angel Research
Source: Market, Angel Research; Note: Level above 50 indicates expansion
Exhibit 5: Exports and imports growth trends
Exhibit 6: Key policy rates
(%)
Exports yoy growth
Imports yoy growth
(%)
Repo rate
Reverse Repo rate
CRR
5.0
7.00
0.0
6.50
(5.0)
6.00
(10.0)
5.50
(15.0)
5.00
(20.0)
4.50
(25.0)
4.00
(30.0)
3.50
(35.0)
3.00
Source: Bloomberg, Angel Research
Source: RBI, Angel Research
Market Outlook
October 06, 2016
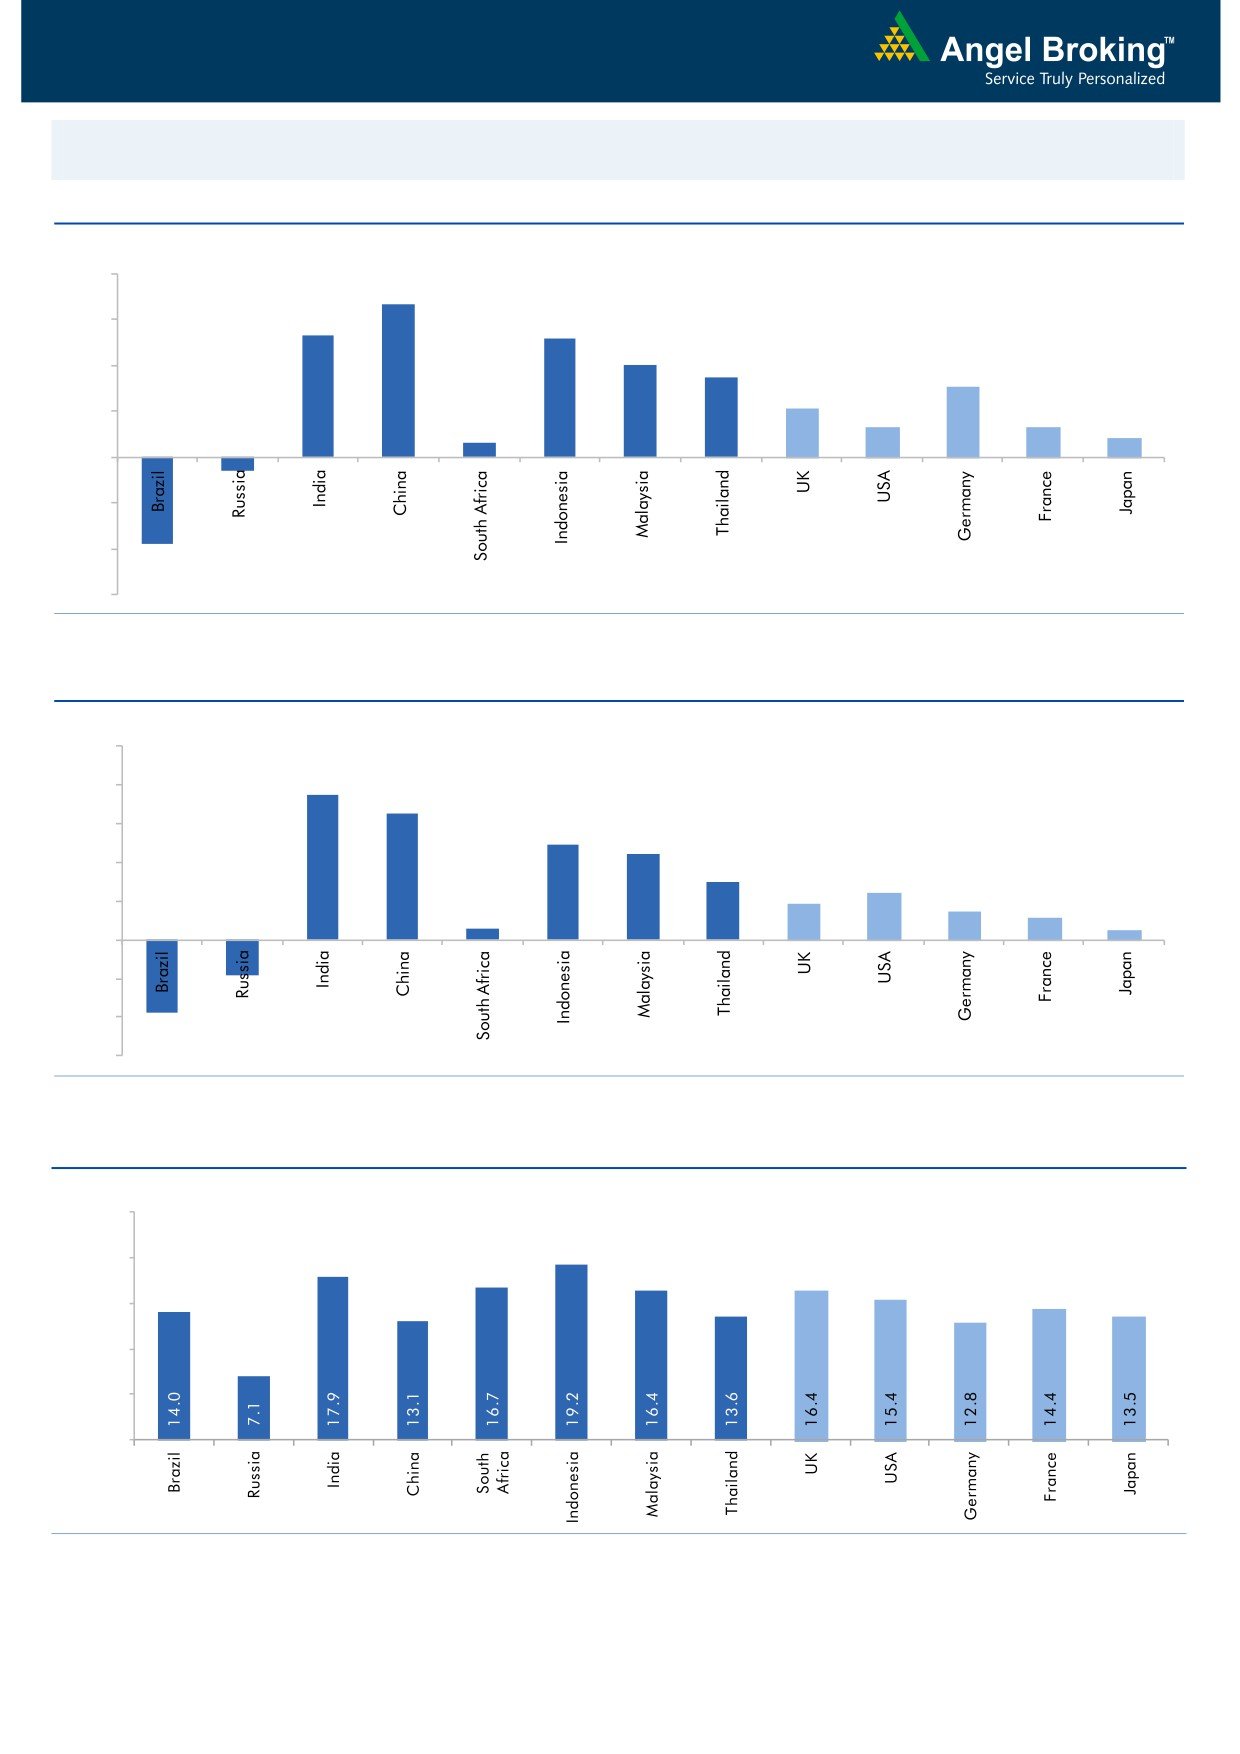
Global watch
Exhibit 1: Latest quarterly GDP Growth (%, yoy) across select developing and developed countries
(%)
8.0
6.7
6.0
5.3
0.6
5.2
4.0
3.5
4.0
3.1
2.1
2.0
1.3
1.3
0.8
-
(2.0)
(0.6)
(4.0)
(3.8)
(6.0)
Source: Bloomberg, Angel Research
Exhibit 2: 2016 GDP Growth projection by IMF (%, yoy) across select developing and developed countries
(%)
10.0
7.5
8.0
6.5
6.0
4.9
4.4
4.0
3.0
2.4
1.9
1.5
2.0
1.1
0.6
0.5
(3.8)
(1.8)
-
(2.0)
(4.0)
(6.0)
Source: IMF, Angel Research
Exhibit 3: One year forward P-E ratio across select developing and developed countries
(x)
25.0
20.0
15.0
10.0
5.0
-
Source: IMF, Angel Research
Market Outlook
October 06, 2016
Exhibit 4: Relative performance of indices across globe
Returns (%)
Country
Name of index
Closing price
1M
3M
1YR
Brazil
Bovespa
59,339
2.7
13.1
35.3
Russia
Micex
1,985
(1.1)
5.4
22.8
India
Nifty
8,769
(0.2)
5.8
11.4
China
Shanghai Composite
3,005
(2.1)
2.6
(5.7)
South Africa
Top 40
45,473
(3.1)
(1.1)
(0.4)
Mexico
Mexbol
47,909
0.1
3.0
9.3
Indonesia
LQ45
947
3.4
15.0
29.7
Malaysia
KLCI
1,661
(1.2)
1.7
3.0
Thailand
SET 50
964
(0.1)
5.9
8.4
USA
Dow Jones
18,168
(0.8)
1.7
8.8
UK
FTSE
7,074
2.6
8.1
11.6
Japan
Nikkei
16,736
(0.9)
7.4
(4.8)
Germany
DAX
10,620
0.4
11.0
6.1
France
CAC
4,503
(0.9)
10.2
(3.1)
Source: Bloomberg, Angel Research
Stock Watch
October 06, 2016
Company Name
Reco
CMP
Target
Mkt Cap
Sales ( Čcr )
OPM(%)
EPS (Č)
PER(x)
P/BV(x)
RoE(%)
EV/Sales(x)
(Č)
Price ( Č)
( Č cr )
FY17E FY18E
FY17E
FY18E
FY17E
FY18E
FY17E
FY18E
FY17E
FY18E
FY17E
FY18E
FY17E
FY18E
Agri / Agri Chemical
Rallis
Neutral
238
-
4,621
1,937
2,164
13.3
14.3
9.0
11.0
26.4
21.6
4.6
4.0
18.4
19.8
2.4
2.1
United Phosphorus
Neutral
681
-
34,516
15,176
17,604
18.5
18.5
37.4
44.6
18.2
15.3
3.6
3.0
21.4
21.2
2.4
2.0
Auto & Auto Ancillary
Ashok Leyland
Buy
82
111
23,251
22,407
26,022
10.6
10.6
5.2
6.4
15.7
12.7
3.5
3.0
23.6
24.7
1.1
0.9
Bajaj Auto
Neutral
2,857
-
82,678
25,093
27,891
19.5
19.2
143.9
162.5
19.9
17.6
5.6
4.8
30.3
29.4
3.0
2.6
Bharat Forge
Neutral
927
-
21,577
7,726
8,713
20.5
21.2
35.3
42.7
26.3
21.7
4.9
4.4
18.9
20.1
2.9
2.5
Eicher Motors
Neutral
26,281
-
71,383
16,583
20,447
17.5
18.0
598.0
745.2
44.0
35.3
15.0
11.4
41.2
38.3
4.1
3.3
Gabriel India
Neutral
122
-
1,755
1,544
1,715
9.0
9.3
5.4
6.3
22.6
19.4
4.3
3.8
18.9
19.5
1.1
1.0
Hero Motocorp
Neutral
3,490
-
69,699
31,253
35,198
15.3
15.0
172.3
192.1
20.3
18.2
7.4
6.4
38.9
37.0
2.1
1.8
Jamna Auto Industries Neutral
217
-
1,732
1,486
1,620
9.8
9.9
15.0
17.2
14.5
12.6
3.2
2.7
21.8
21.3
1.2
1.1
L G Balakrishnan & Bros Neutral
622
-
977
1,302
1,432
11.6
11.9
43.7
53.0
14.3
11.7
2.0
1.8
13.8
14.2
0.8
0.8
Mahindra and Mahindra Neutral
1,399
-
86,885
46,534
53,077
11.6
11.7
67.3
78.1
20.8
17.9
3.4
3.0
15.4
15.8
1.8
1.6
Maruti
Neutral
5,692
-
171,938
69,186
82,217
14.7
14.4
198.5
241.4
28.7
23.6
5.6
4.5
20.2
20.0
2.2
1.8
Minda Industries
Neutral
320
-
2,536
2,728
3,042
9.0
9.1
68.2
86.2
4.7
3.7
1.1
0.8
23.8
24.3
1.0
0.9
Motherson Sumi
Neutral
333
-
46,740
45,896
53,687
7.8
8.3
13.0
16.1
25.5
20.7
8.2
6.6
34.7
35.4
1.1
0.9
Rane Brake Lining
Neutral
1,161
-
919
511
562
11.3
11.5
28.1
30.9
41.3
37.6
6.3
5.7
15.3
15.0
1.9
1.8
Setco Automotive
Neutral
42
-
563
741
837
13.0
13.0
15.2
17.0
2.8
2.5
0.5
0.4
15.8
16.3
1.1
1.0
Tata Motors
Neutral
558
-
161,135
300,209
338,549
8.9
8.4
42.7
54.3
13.1
10.3
2.1
1.8
15.6
17.2
0.7
0.6
TVS Motor
Neutral
380
-
18,032
13,390
15,948
6.9
7.1
12.8
16.5
29.7
22.9
7.4
5.9
26.3
27.2
1.4
1.1
Amara Raja Batteries
Accumulate
1,055
1,174
18,017
5,429
6,471
17.5
17.6
35.3
43.5
29.9
24.3
6.9
5.6
25.3
24.8
3.2
2.6
Exide Industries
Neutral
194
-
16,528
7,439
8,307
15.0
15.0
8.1
9.3
24.0
20.9
3.4
3.0
14.3
16.7
1.8
1.6
Apollo Tyres
Neutral
230
-
11,695
12,877
14,504
14.3
13.9
21.4
23.0
10.7
10.0
1.7
1.5
16.4
15.2
1.1
1.0
Ceat
Neutral
1,396
-
5,646
7,524
8,624
13.0
12.7
131.1
144.3
10.7
9.7
2.0
1.7
19.8
18.6
0.8
0.7
JK Tyres
Neutral
158
-
3,572
7,455
8,056
15.0
15.0
21.8
24.5
7.2
6.4
1.5
1.2
22.8
21.3
0.6
0.5
Swaraj Engines
Neutral
1,380
-
1,714
660
810
15.2
16.4
54.5
72.8
25.3
19.0
7.9
7.2
31.5
39.2
2.4
1.9
Subros
Neutral
135
-
810
1,488
1,681
11.7
11.9
6.4
7.2
21.1
18.8
2.2
2.0
10.8
11.4
0.8
0.7
Indag Rubber
Neutral
221
-
580
286
326
19.8
16.8
11.7
13.3
18.9
16.6
3.2
3.0
17.8
17.1
1.7
1.5
Capital Goods
ACE
Neutral
46
-
451
709
814
4.1
4.6
1.4
2.1
32.6
21.7
1.3
1.3
4.4
6.0
0.8
0.7
BEML
Buy
904
1,157
3,765
3,451
4,055
6.3
9.2
31.4
57.9
28.8
15.6
1.7
1.6
6.3
10.9
1.2
1.0
Bharat Electronics
Accumulate
1,273
1,414
30,551
8,137
9,169
16.8
17.2
58.7
62.5
21.7
20.4
3.4
3.0
44.6
46.3
2.7
2.5
Stock Watch
October 06, 2016
Company Name
Reco
CMP
Target
Mkt Cap
Sales ( Čcr )
OPM(%)
EPS (Č)
PER(x)
P/BV(x)
RoE(%)
EV/Sales(x)
(Č)
Price ( Č)
( Č cr )
FY17E
FY18E
FY17E
FY18E
FY17E
FY18E
FY17E
FY18E
FY17E
FY18E
FY17E
FY18E
FY17E
FY18E
Capital Goods
Voltas
Neutral
395
-
13,083
6,511
7,514
7.9
8.7
12.9
16.3
30.7
24.3
5.5
4.8
16.7
18.5
1.8
1.5
BGR Energy
Neutral
114
-
826
16,567
33,848
6.0
5.6
7.8
5.9
14.7
19.4
0.8
0.8
4.7
4.2
0.2
0.1
BHEL
Neutral
137
-
33,544
28,797
34,742
-
2.8
2.3
6.9
59.6
19.9
1.0
1.0
1.3
4.8
0.8
0.6
Blue Star
Neutral
570
-
5,432
4,351
5,024
6.4
7.1
17.2
20.6
33.2
27.6
21.6
18.0
23.1
24.1
1.3
1.1
Crompton Greaves
Neutral
79
-
4,932
5,777
6,120
5.9
7.0
3.3
4.5
23.9
17.5
1.1
1.0
4.4
5.9
0.8
0.7
Greaves Cotton
Neutral
128
-
3,134
1,755
1,881
16.8
16.9
7.8
8.5
16.5
15.1
3.3
3.1
20.6
20.9
1.5
1.3
Inox Wind
Buy
209
286
4,646
5,605
6,267
15.7
16.4
24.8
30.0
8.4
7.0
2.4
1.7
25.9
24.4
0.9
0.7
KEC International
Neutral
124
-
3,175
9,294
10,186
7.9
8.1
9.9
11.9
12.5
10.4
1.8
1.6
15.6
16.3
0.6
0.5
Thermax
Neutral
910
-
10,843
5,421
5,940
7.3
7.3
25.7
30.2
35.4
30.1
4.3
3.9
12.2
13.1
1.9
1.7
VATech Wabag
Buy
557
681
3,034
3,136
3,845
8.9
9.1
26.0
35.9
21.4
15.5
2.7
2.3
13.4
15.9
0.9
0.7
Cement
ACC
Neutral
1,639
-
30,770
11,225
13,172
13.2
16.9
44.5
75.5
36.8
21.7
3.5
3.2
11.2
14.2
2.7
2.3
Ambuja Cements
Neutral
257
-
50,972
9,350
10,979
18.2
22.5
5.8
9.5
44.3
27.0
3.7
3.3
10.2
12.5
5.5
4.6
India Cements
Neutral
158
-
4,846
4,364
4,997
18.5
19.2
7.9
11.3
20.0
14.0
1.4
1.4
8.0
8.5
1.9
1.6
JK Cement
Neutral
897
-
6,274
4,398
5,173
15.5
17.5
31.2
55.5
28.8
16.2
3.5
3.0
12.0
15.5
2.0
1.6
J K Lakshmi Cement
Neutral
507
-
5,969
2,913
3,412
14.5
19.5
7.5
22.5
67.6
22.5
4.2
3.5
12.5
18.0
2.6
2.2
Orient Cement
Neutral
224
-
4,582
2,114
2,558
18.5
20.5
8.1
11.3
27.6
19.8
4.1
3.4
9.0
14.0
2.8
2.2
UltraTech Cement
Neutral
4,034
-
110,699
25,768
30,385
21.0
23.5
111.0
160.0
36.3
25.2
4.6
4.1
13.5
15.8
4.4
3.7
Construction
ITNL
Neutral
107
-
3,505
8,946
10,017
31.0
31.6
8.1
9.1
13.2
11.7
0.5
0.5
4.2
5.0
3.7
3.5
KNR Constructions
Neutral
772
-
2,171
1,385
1,673
14.7
14.0
41.2
48.5
18.7
15.9
3.5
3.0
14.9
15.2
1.6
1.4
Larsen & Toubro
Buy
1,453
1,700
135,435
67,665
77,249
10.7
11.5
57.3
71.2
25.4
20.4
2.3
2.2
12.6
14.3
2.2
1.9
Gujarat Pipavav Port
Neutral
177
-
8,540
705
788
52.2
51.7
5.0
5.6
35.3
31.5
3.5
3.1
11.2
11.2
11.8
10.0
Nagarjuna Const.
Neutral
85
-
4,720
8,842
9,775
9.1
8.8
5.3
6.4
16.0
13.3
1.3
1.2
8.2
9.1
0.7
0.6
PNC Infratech
Accumulate
129
143
3,314
2,350
2,904
13.1
13.2
9.0
8.8
14.4
14.7
0.5
0.5
15.9
13.9
1.5
1.2
Simplex Infra
Neutral
334
-
1,654
6,829
7,954
10.5
10.5
31.4
37.4
10.7
8.9
1.1
1.0
9.9
13.4
0.7
0.6
Power Mech Projects
Neutral
494
-
726
1,801
2,219
12.7
14.6
72.1
113.9
6.9
4.3
1.3
1.1
16.8
11.9
0.4
0.3
Sadbhav Engineering
Neutral
289
-
4,960
3,598
4,140
10.3
10.6
9.0
11.9
32.1
24.3
3.4
3.0
9.9
11.9
1.7
1.4
NBCC
Neutral
281
-
16,851
7,428
9,549
7.9
8.6
8.2
11.0
34.3
25.5
1.7
1.3
28.2
28.7
2.0
1.5
MEP Infra
Neutral
42
-
683
1,877
1,943
30.6
29.8
3.0
4.2
14.0
10.0
6.8
4.6
0.6
0.6
1.7
1.6
SIPL
Neutral
108
-
3,795
1,036
1,252
65.5
66.2
(8.4)
(5.6)
4.0
4.6
(22.8)
(15.9)
11.9
9.9
Stock Watch
October 06, 2016
Company Name
Reco
CMP
Target
Mkt Cap
Sales ( Čcr )
OPM(%)
EPS (Č)
PER(x)
P/BV(x)
RoE(%)
EV/Sales(x)
(Č)
Price ( Č)
( Č cr )
FY17E
FY18E
FY17E
FY18E
FY17E
FY18E
FY17E
FY18E
FY17E
FY18E
FY17E
FY18E
FY17E
FY18E
Construction
Engineers India
Neutral
254
-
8,573
1,725
1,935
16.0
19.1
11.4
13.9
22.3
18.3
3.1
3.0
13.4
15.3
3.9
3.5
Financials
Axis Bank
Neutral
536
-
127,859
58,081
66,459
3.5
3.5
32.4
44.6
16.6
12.0
2.2
1.9
13.6
16.5
-
-
Bank of Baroda
Neutral
170
-
39,056
19,980
23,178
1.8
1.8
11.5
17.3
14.7
9.8
1.7
1.4
8.3
10.1
-
-
Canara Bank
Neutral
335
-
18,187
15,225
16,836
1.8
1.8
14.5
28.0
23.1
12.0
1.6
1.3
5.8
8.5
-
-
Dewan Housing Finance Accumulate
297
325
8,652
2,225
2,688
2.9
2.9
29.7
34.6
10.0
8.6
1.6
1.4
16.1
16.8
-
-
Equitas Holdings
Buy
186
235
6,250
939
1,281
11.7
11.5
5.8
8.2
32.1
22.7
2.8
2.5
10.9
11.5
-
-
Federal Bank
Neutral
74
-
12,749
9,353
10,623
2.9
2.9
4.4
5.8
16.9
12.8
1.6
1.4
9.5
11.0
-
-
HDFC
Neutral
1,421
-
224,624
11,475
13,450
3.4
3.4
45.3
52.5
31.4
27.1
6.1
5.3
20.2
20.5
-
-
HDFC Bank
Accumulate
1,284
1,350
325,177
46,097
55,433
4.5
4.5
58.4
68.0
22.0
18.9
3.9
3.2
18.8
18.6
-
-
ICICI Bank
Neutral
256
-
148,710
39,029
45,903
3.3
3.3
16.7
16.3
15.3
15.7
1.9
1.7
10.1
12.4
-
-
LIC Housing Finance
Neutral
593
-
29,901
3,712
4,293
2.6
2.5
39.0
46.0
15.2
12.9
2.9
2.4
19.9
20.1
-
-
Punjab Natl.Bank
Neutral
144
-
30,707
23,532
23,595
2.3
2.4
6.8
12.6
21.2
11.5
3.3
2.3
3.3
6.5
-
-
RBL Bank
Accumulate
296
325
10,933
1,783
2,309
2.6
2.6
12.7
16.4
23.3
18.0
2.5
2.3
12.8
13.3
-
-
South Ind.Bank
Neutral
25
-
3,376
6,435
7,578
2.5
2.5
2.7
3.1
9.3
8.1
1.2
1.0
10.1
11.2
-
-
St Bk of India
Neutral
261
-
202,259
88,650
98,335
2.6
2.6
13.5
18.8
19.3
13.9
1.8
1.6
7.0
8.5
-
-
Union Bank
Neutral
152
-
10,453
13,450
14,925
2.3
2.3
25.5
34.5
6.0
4.4
0.9
0.7
7.5
10.2
-
-
Yes Bank
Neutral
1,279
-
53,846
8,978
11,281
3.3
3.4
74.0
90.0
17.3
14.2
3.3
2.8
17.0
17.2
-
-
FMCG
Asian Paints
Neutral
1,209
-
115,953
17,128
18,978
16.8
16.4
19.1
20.7
63.3
58.4
22.0
20.8
34.8
35.5
6.7
6.0
Britannia
Neutral
3,464
-
41,564
9,795
11,040
14.6
14.9
80.3
94.0
43.1
36.9
17.7
13.7
41.2
-
4.1
3.6
Colgate
Neutral
981
-
26,683
4,605
5,149
23.4
23.4
23.8
26.9
41.2
36.5
22.8
17.8
64.8
66.8
5.7
5.1
Dabur India
Neutral
283
-
49,766
8,315
9,405
19.8
20.7
8.1
9.2
34.9
30.8
9.7
8.1
31.6
31.0
5.6
5.0
GlaxoSmith Con*
Neutral
6,194
-
26,051
4,350
4,823
21.2
21.4
179.2
196.5
34.6
31.5
9.2
7.8
27.1
26.8
5.4
4.8
Godrej Consumer
Neutral
1,621
-
55,216
10,235
11,428
18.4
18.6
41.1
44.2
39.5
36.7
8.8
7.4
24.9
24.8
5.5
4.8
HUL
Neutral
871
-
188,571
35,252
38,495
17.6
17.4
20.4
21.9
42.7
39.8
35.1
30.7
82.2
77.3
5.2
4.7
ITC
Buy
240
283
290,062
40,059
44,439
39.0
39.2
9.1
10.1
26.4
23.8
7.2
6.3
27.2
26.5
6.7
6.0
Marico
Neutral
286
-
36,951
6,430
7,349
18.8
19.5
6.4
7.7
44.8
37.2
13.5
11.4
33.2
32.5
5.6
4.8
Nestle*
Neutral
6,758
-
65,162
10,073
11,807
20.7
21.5
124.8
154.2
54.2
43.8
22.2
20.0
34.8
36.7
6.3
5.3
Tata Global
Neutral
153
-
9,675
8,675
9,088
9.8
9.8
7.4
8.2
20.7
18.7
2.4
2.3
7.9
8.1
1.0
1.0
Procter & Gamble
Neutral
7,073
-
22,959
2,939
3,342
23.2
23.0
146.2
163.7
48.4
43.2
108.3
103.9
25.3
23.5
7.4
6.4
Hygiene
Stock Watch
October 06, 2016
Company Name
Reco
CMP
Target
Mkt Cap
Sales ( Čcr )
OPM(%)
EPS (Č)
PER(x)
P/BV(x)
RoE(%)
EV/Sales(x)
(Č)
Price ( Č)
( Č cr )
FY17E FY18E
FY17E
FY18E
FY17E
FY18E
FY17E
FY18E
FY17E
FY18E
FY17E
FY18E
FY17E
FY18E
IT
HCL Tech^
Buy
816
1,000
115,068
49,242
57,168
20.5
20.5
55.7
64.1
14.6
12.7
3.0
2.3
20.3
17.9
2.2
1.8
Infosys
Buy
1,041
1,370
239,146
69,934
79,025
27.5
27.5
64.8
72.0
16.1
14.5
3.5
3.2
22.0
22.3
2.9
2.5
TCS
Buy
2,383
3,004
469,464
121,684
136,286
27.3
27.3
135.0
150.1
17.7
15.9
5.9
5.4
33.2
33.9
3.6
3.2
Tech Mahindra
Buy
425
700
41,274
30,347
33,685
17.0
17.0
37.5
41.3
11.3
10.3
2.5
2.1
21.8
20.7
1.1
0.9
Wipro
Buy
479
680
116,420
51,631
55,822
21.7
17.9
35.9
36.9
13.3
13.0
2.8
2.6
19.0
18.1
1.9
1.7
Media
D B Corp
Neutral
396
-
7,271
2,297
2,590
27.4
28.2
21.0
23.4
18.8
16.9
4.4
3.8
23.7
23.1
3.0
2.6
HT Media
Neutral
88
-
2,044
2,693
2,991
12.6
12.9
7.9
9.0
11.1
9.8
0.9
0.9
7.8
8.3
0.3
0.2
Jagran Prakashan
Accumulate
204
225
6,667
2,355
2,635
28.0
28.0
10.8
12.5
18.9
16.3
4.1
3.5
21.7
21.7
2.8
2.5
Sun TV Network
Neutral
526
-
20,723
2,850
3,265
70.1
71.0
26.2
30.4
20.1
17.3
5.1
4.5
24.3
25.6
6.9
5.9
Hindustan Media
Neutral
294
-
2,155
1,016
1,138
24.3
25.2
27.3
30.1
10.8
9.8
2.0
1.8
16.2
15.8
1.4
1.3
Ventures
TV Today Network
Buy
311
363
1,855
637
743
27.5
27.5
18.4
21.4
16.9
14.5
3.0
2.5
17.4
17.2
2.5
2.1
Metals & Mining
Coal India
Neutral
322
-
203,229
84,638
94,297
21.4
22.3
24.5
27.1
13.1
11.9
5.5
5.2
42.6
46.0
1.9
1.7
Hind. Zinc
Neutral
253
-
106,732
14,252
18,465
55.9
48.3
15.8
21.5
16.0
11.8
2.6
2.3
17.0
20.7
7.5
5.8
Hindalco
Neutral
157
-
32,420
107,899
112,095
7.4
8.2
9.2
13.0
17.1
12.1
0.8
0.8
4.8
6.6
0.8
0.8
JSW Steel
Neutral
1,789
-
43,242
53,201
58,779
16.1
16.2
130.6
153.7
13.7
11.6
1.8
1.6
14.0
14.4
1.6
1.4
NMDC
Neutral
111
-
44,187
6,643
7,284
44.4
47.7
7.1
7.7
15.7
14.5
1.4
1.3
8.8
9.2
4.4
4.0
SAIL
Neutral
49
-
20,072
47,528
53,738
(0.7)
2.1
(1.9)
2.6
18.7
0.5
0.5
(1.6)
3.9
1.3
1.2
Vedanta
Neutral
192
-
56,833
71,744
81,944
19.2
21.7
13.4
20.1
14.3
9.5
1.2
1.1
8.4
11.3
1.2
0.9
Tata Steel
Neutral
390
-
37,911
121,374
121,856
7.2
8.4
18.6
34.3
21.0
11.4
1.3
1.2
6.1
10.1
1.0
0.9
Oil & Gas
Cairn India
Neutral
221
-
41,444
9,127
10,632
4.3
20.6
8.8
11.7
25.1
18.9
0.8
0.8
3.3
4.2
6.0
5.0
GAIL
Neutral
401
-
50,822
56,220
65,198
9.3
10.1
27.1
33.3
14.8
12.0
1.4
1.3
9.3
10.7
1.1
0.9
ONGC
Neutral
267
-
228,218
137,222
152,563
15.0
21.8
19.5
24.1
13.7
11.1
1.2
1.1
8.5
10.1
1.9
1.7
Indian Oil Corp
Neutral
618
-
149,975
373,359
428,656
5.9
5.5
54.0
59.3
11.4
10.4
1.8
1.6
16.0
15.6
0.6
0.5
Reliance Industries
Neutral
1,089
-
353,200
301,963
358,039
12.1
12.6
87.7
101.7
12.4
10.7
1.3
1.2
10.7
11.3
1.6
1.4
Pharmaceuticals
Alembic Pharma
Neutral
680
-
12,817
3,483
4,083
20.2
21.4
24.3
30.4
28.0
22.4
6.4
5.1
25.5
25.3
3.6
3.0
Aurobindo Pharma
Neutral
865
-
50,626
15,720
18,078
23.7
23.7
41.4
47.3
20.9
18.3
5.4
4.3
29.6
26.1
3.4
3.0
Aventis*
Neutral
4,182
-
9,630
2,357
2,692
17.3
17.3
153.5
169.2
27.2
24.7
4.6
3.7
25.8
28.4
3.8
3.1
Cadila Healthcare
Neutral
389
-
39,783
11,126
13,148
22.0
22.0
17.1
20.0
22.7
19.4
5.8
4.6
28.8
26.6
3.6
2.9
Cipla
Sell
593
490
47,636
15,378
18,089
17.4
18.4
21.6
27.2
27.4
21.8
3.6
3.1
13.7
15.2
3.3
2.8
Stock Watch
October 06, 2016
Company Name
Reco
CMP
Target
Mkt Cap
Sales ( Čcr )
OPM(%)
EPS (Č)
PER(x)
P/BV(x)
RoE(%)
EV/Sales(x)
(Č)
Price ( Č)
( Č cr )
FY17E FY18E
FY17E
FY18E
FY17E
FY18E
FY17E
FY18E
FY17E
FY18E
FY17E
FY18E
FY17E
FY18E
Pharmaceuticals
Dr Reddy's
Neutral
3,121
-
51,717
16,043
18,119
23.1
24.7
126.0
157.8
24.8
19.8
3.7
3.2
15.7
17.1
3.2
2.8
Dishman Pharma
Sell
250
45
4,032
1,718
1,890
22.7
22.8
9.5
11.3
26.3
22.1
2.5
2.3
10.1
10.9
2.8
2.5
GSK Pharma*
Neutral
2,876
-
24,356
3,528
3,811
16.6
18.8
51.8
59.4
55.5
48.4
14.9
14.8
26.3
30.6
6.7
6.2
Indoco Remedies
Sell
317
225
2,922
1,112
1,289
18.2
18.2
13.2
15.6
24.0
20.3
4.3
3.6
19.2
19.2
2.7
2.4
Ipca labs
Neutral
618
-
7,801
3,303
3,799
15.3
15.3
17.3
19.7
35.7
31.4
3.1
2.8
9.1
9.4
2.5
2.2
Lupin
Buy
1,491
1,809
67,229
15,912
18,644
26.4
26.7
58.1
69.3
25.7
21.5
5.0
4.1
21.4
20.9
4.3
3.5
Sun Pharma
Buy
760
944
182,812
31,129
35,258
30.0
30.9
28.0
32.8
27.1
23.2
4.2
3.5
18.7
18.9
5.5
4.6
Power
Tata Power
Neutral
78
-
21,177
36,916
39,557
17.4
27.1
5.1
6.3
15.4
12.4
1.4
1.2
9.0
10.3
1.6
1.4
NTPC
Neutral
153
-
125,949
86,605
95,545
17.5
20.8
11.8
13.4
12.9
11.4
1.3
1.2
10.5
11.1
2.8
2.8
Power Grid
Neutral
181
-
94,587
25,763
29,762
74.3
73.1
14.8
17.3
12.2
10.5
1.9
1.7
16.9
17.5
7.9
7.6
Real Estate
Prestige Estate
Neutral
206
-
7,733
4,707
5,105
25.2
26.0
10.3
13.0
20.0
15.9
1.6
1.5
10.3
10.2
2.8
2.5
MLIFE
Buy
439
522
1,803
1,152
1,300
22.7
24.6
29.9
35.8
14.7
12.3
1.1
1.0
7.6
8.6
2.3
1.9
Telecom
Bharti Airtel
Neutral
322
-
128,756
105,086
114,808
34.5
34.7
12.2
16.4
26.4
19.6
1.8
1.7
6.8
8.4
2.1
1.9
Idea Cellular
Neutral
80
-
28,788
40,133
43,731
37.2
37.1
6.4
6.5
12.5
12.3
1.0
1.0
8.2
7.6
1.7
1.5
zOthers
Abbott India
Neutral
4,759
-
10,113
3,153
3,583
14.1
14.4
152.2
182.7
31.3
26.1
153.5
131.1
25.6
26.1
2.9
2.5
Bajaj Electricals
Accumulate
267
306
2,699
5,099
5,805
5.6
5.9
11.4
14.6
23.5
18.3
3.1
2.8
13.4
15.1
0.5
0.5
Finolex Cables
Neutral
448
-
6,854
2,883
3,115
12.0
12.1
14.2
18.6
31.6
24.1
16.8
14.7
15.8
14.6
2.1
1.9
Goodyear India*
Neutral
780
-
1,799
1,598
1,704
10.4
10.2
49.4
52.6
15.8
14.8
72.9
63.9
18.2
17.0
0.8
114.0
Hitachi
Neutral
1,630
-
4,431
2,081
2,433
8.8
8.9
33.4
39.9
48.8
40.8
39.4
32.8
22.1
21.4
2.1
1.8
Jyothy Laboratories
Neutral
362
-
6,572
1,440
2,052
11.5
13.0
8.5
10.0
42.6
36.2
10.3
9.6
18.6
19.3
4.8
3.4
Page Industries
Neutral
15,913
-
17,749
2,450
3,124
20.1
17.6
299.0
310.0
53.2
51.3
354.4
270.6
47.1
87.5
7.3
5.7
Relaxo Footwears
Neutral
457
-
5,485
2,085
2,469
9.2
8.2
7.6
8.0
60.5
57.5
23.4
20.0
17.9
18.8
2.7
2.3
Siyaram Silk Mills
Neutral
1,418
-
1,329
1,799
2,040
11.6
11.7
104.9
122.4
13.5
11.6
2.2
1.9
16.4
16.4
0.9
0.8
Styrolution ABS India*
Neutral
604
-
1,062
1,440
1,537
9.2
9.0
40.6
42.6
14.9
14.2
38.0
34.5
12.3
11.6
0.7
0.6
TVS Srichakra
Neutral
3,955
-
3,028
2,304
2,614
13.7
13.8
231.1
266.6
17.1
14.8
444.3
349.9
33.9
29.3
1.3
1.1
HSIL
Neutral
348
-
2,518
2,384
2,515
15.8
16.3
15.3
19.4
22.8
18.0
22.6
19.5
7.8
9.3
1.2
1.1
Kirloskar Engines India
Neutral
354
-
5,114
2,554
2,800
9.9
10.0
10.5
12.1
33.7
29.2
14.1
13.3
10.7
11.7
1.6
1.5
Ltd
M M Forgings
Neutral
422
-
509
546
608
20.4
20.7
41.3
48.7
10.2
8.7
57.8
51.1
16.6
17.0
0.8
0.7
Banco Products (India)
Neutral
219
-
1,568
1,353
1,471
12.3
12.4
14.5
16.3
15.1
13.5
20.9
18.8
14.5
14.6
1.1
118.1
Stock Watch
October 06, 2016
Company Name
Reco
CMP
Target
Mkt Cap
Sales ( Čcr )
OPM(%)
EPS (Č)
PER(x)
P/BV(x)
RoE(%)
EV/Sales(x)
(Č)
Price ( Č)
( Č cr )
FY17E
FY18E
FY17E
FY18E
FY17E
FY18E
FY17E
FY18E
FY17E
FY18E
FY17E
FY18E
FY17E
FY18E
zOthers
Competent Automobiles Neutral
197
-
121
1,137
1,256
3.1
2.7
28.0
23.6
7.0
8.4
37.9
34.2
14.3
11.5
0.1
0.1
Nilkamal
Neutral
1,355
-
2,023
1,995
2,165
10.7
10.4
69.8
80.6
19.4
16.8
77.5
67.3
16.6
16.5
1.0
0.9
Visaka Industries
Neutral
195
-
310
1,051
1,138
10.3
10.4
21.0
23.1
9.3
8.4
25.0
23.4
9.0
9.2
0.6
0.5
Transport Corporation of
Neutral
185
-
1,417
2,671
2,911
8.5
8.8
13.9
15.7
13.4
11.8
1.8
1.6
13.7
13.8
0.6
0.6
India
Elecon Engineering
Neutral
61
-
659
1,482
1,660
13.7
14.5
3.9
5.8
15.5
10.4
3.6
3.4
7.8
10.9
0.8
0.7
Surya Roshni
Neutral
230
-
1,006
3,342
3,625
7.8
7.5
17.3
19.8
13.3
11.6
25.2
20.2
10.5
10.8
0.6
0.5
MT Educare
Neutral
148
-
589
366
417
17.7
18.2
9.4
10.8
15.8
13.7
3.5
3.1
22.2
22.3
1.5
1.3
Radico Khaitan
Neutral
137
-
1,817
1,659
1,802
13.0
13.2
6.3
7.4
21.6
18.5
1.9
1.7
8.6
9.3
1.5
1.4
Garware Wall Ropes
Neutral
550
-
1,203
873
938
12.9
13.1
30.9
34.9
17.8
15.8
2.8
2.4
15.7
15.2
1.3
1.2
Wonderla Holidays
Neutral
400
-
2,262
287
355
38.0
40.0
11.3
14.2
35.4
28.2
5.1
4.4
21.4
23.9
7.6
6.1
Linc Pen & Plastics
Neutral
279
-
413
382
420
9.3
9.5
13.5
15.7
20.7
17.8
3.6
3.1
17.1
17.3
1.1
1.0
The Byke Hospitality
Neutral
191
-
767
287
384
20.5
20.5
7.6
10.7
25.2
17.9
5.3
4.3
20.7
23.5
2.7
2.0
Interglobe Aviation
Neutral
950
-
34,230
21,122
26,005
14.5
27.6
110.7
132.1
8.6
7.2
51.4
36.7
168.5
201.1
1.6
1.3
Coffee Day Enterprises
Neutral
232
-
4,782
2,964
3,260
20.5
21.2
4.7
8.0
-
29.0
2.7
2.5
5.5
8.5
2.0
1.8
Ltd
Navneet Education
Neutral
101
-
2,417
1,062
1,147
24.0
24.0
6.1
6.6
16.7
15.3
3.4
3.0
20.6
19.8
2.4
2.2
Navkar Corporation
Buy
193
265
2,752
408
612
42.9
42.3
6.8
11.5
28.5
16.8
2.0
1.8
6.9
10.5
7.7
5.1
UFO Moviez
Neutral
477
-
1,315
619
685
33.2
33.4
30.0
34.9
15.9
13.7
2.2
1.9
13.8
13.9
1.8
1.5
VRL Logistics
Neutral
310
-
2,825
1,902
2,119
16.7
16.6
14.6
16.8
21.3
18.4
4.7
4.1
21.9
22.2
1.6
1.4
Team Lease Serv.
Neutral
1,065
-
1,821
3,229
4,001
1.5
1.8
22.8
32.8
46.8
32.4
5.0
4.3
10.7
13.4
0.5
0.4
S H Kelkar & Co.
Neutral
304
-
4,402
1,036
1,160
15.1
15.0
6.1
7.2
49.8
42.4
5.3
4.9
10.7
11.5
4.1
3.6
Quick Heal
Neutral
231
-
1,619
408
495
27.3
27.0
7.7
8.8
29.9
26.3
2.8
2.8
9.3
10.6
3.1
2.6
Narayana Hrudaya
Neutral
340
-
6,949
1,873
2,166
11.5
11.7
2.6
4.0
128.6
85.8
7.9
7.1
6.1
8.3
3.8
3.3
Manpasand Bever.
Neutral
761
-
3,809
836
1,087
19.6
19.4
16.9
23.8
45.0
32.0
5.4
4.7
12.0
14.8
4.3
3.2
Parag Milk Foods
Neutral
307
-
2,581
1,919
2,231
9.3
9.6
9.5
12.9
32.5
23.7
5.0
4.2
15.5
17.5
1.5
1.3
Mirza International
Buy
94
113
1,131
1,024
1,148
18.0
18.0
6.9
8.0
13.6
11.8
2.3
1.9
16.6
16.2
1.3
1.1
Asian Granito
Buy
283
351
852
1,118
1,220
11.8
12.0
13.0
16.0
21.8
17.7
2.1
1.9
9.7
10.7
1.0
0.9
Source: Company, Angel Research; Note: *December year end; #September year end; &October year end; Price as on October 05, 2016
Market Outlook
October 06, 2016
Research Team Tel: 022 - 39357800
DISCLAIMER
Angel Broking Private Limited (hereinafter referred to as “Angel”) is a registered Member of National Stock Exchange of India
Limited,Bombay Stock Exchange Limited and Metropolitan Stock Exchange Limited. It is also registered as a Depository Participant with
CDSL and Portfolio Manager with SEBI. It also has registration with AMFI as a Mutual Fund Distributor. Angel Broking Private Limited is a
registered entity with SEBI for Research Analyst in terms of SEBI (Research Analyst) Regulations, 2014 vide registration number
INH000000164. Angel or its associates has not been debarred/ suspended by SEBI or any other regulatory authority for accessing
/dealing in securities Market. Angel or its associates/analyst has not received any compensation / managed or
co-managed public offering of securities of the company covered by Analyst during the past twelve months.
This document is solely for the personal information of the recipient, and must not be singularly used as the basis of any investment
decision. Nothing in this document should be construed as investment or financial advice. Each recipient of this document should make
such investigations as they deem necessary to arrive at an independent evaluation of an investment in the securities of the companies
referred to in this document (including the merits and risks involved), and should consult their own advisors to determine the merits and
risks of such an investment.
Reports based on technical and derivative analysis center on studying charts of a stock's price movement, outstanding positions and
trading volume, as opposed to focusing on a company's fundamentals and, as such, may not match with a report on a company's
fundamentals. Investors are advised to refer the Fundamental and Technical Research Reports available on our website to evaluate the
contrary view, if any.
The information in this document has been printed on the basis of publicly available information, internal data and other reliable
sources believed to be true, but we do not represent that it is accurate or complete and it should not be relied on as such, as this
document is for general guidance only. Angel Broking Pvt. Limited or any of its affiliates/ group companies shall not be in any way
responsible for any loss or damage that may arise to any person from any inadvertent error in the information contained in this report.
Angel Broking Pvt. Limited has not independently verified all the information contained within this document. Accordingly, we cannot
testify, nor make any representation or warranty, express or implied, to the accuracy, contents or data contained within this document.
While Angel Broking Pvt. Limited endeavors to update on a reasonable basis the information discussed in this material, there may be
regulatory, compliance, or other reasons that prevent us from doing so.
This document is being supplied to you solely for your information, and its contents, information or data may not be reproduced,
redistributed or passed on, directly or indirectly.
Neither Angel Broking Pvt. Limited, nor its directors, employees or affiliates shall be liable for any loss or damage that may arise from
or in connection with the use of this information.